> ## Documentation Index
> Fetch the complete documentation index at: https://docs.neuralfactory.ai/llms.txt
> Use this file to discover all available pages before exploring further.
# Analytics
> Monitor platform usage with interaction logs and usage charts.
# Analytics
The Analytics section gives administrators visibility into platform usage — conversations, agent performance, and usage patterns.
## Interactions log
The interactions log records all conversations:
* **User** — Who initiated the conversation
* **Agent** — Which agent was used
* **Timestamp** — When the conversation happened
* **Message count** — Number of messages
* **Feedback** — User ratings (thumbs up/down)
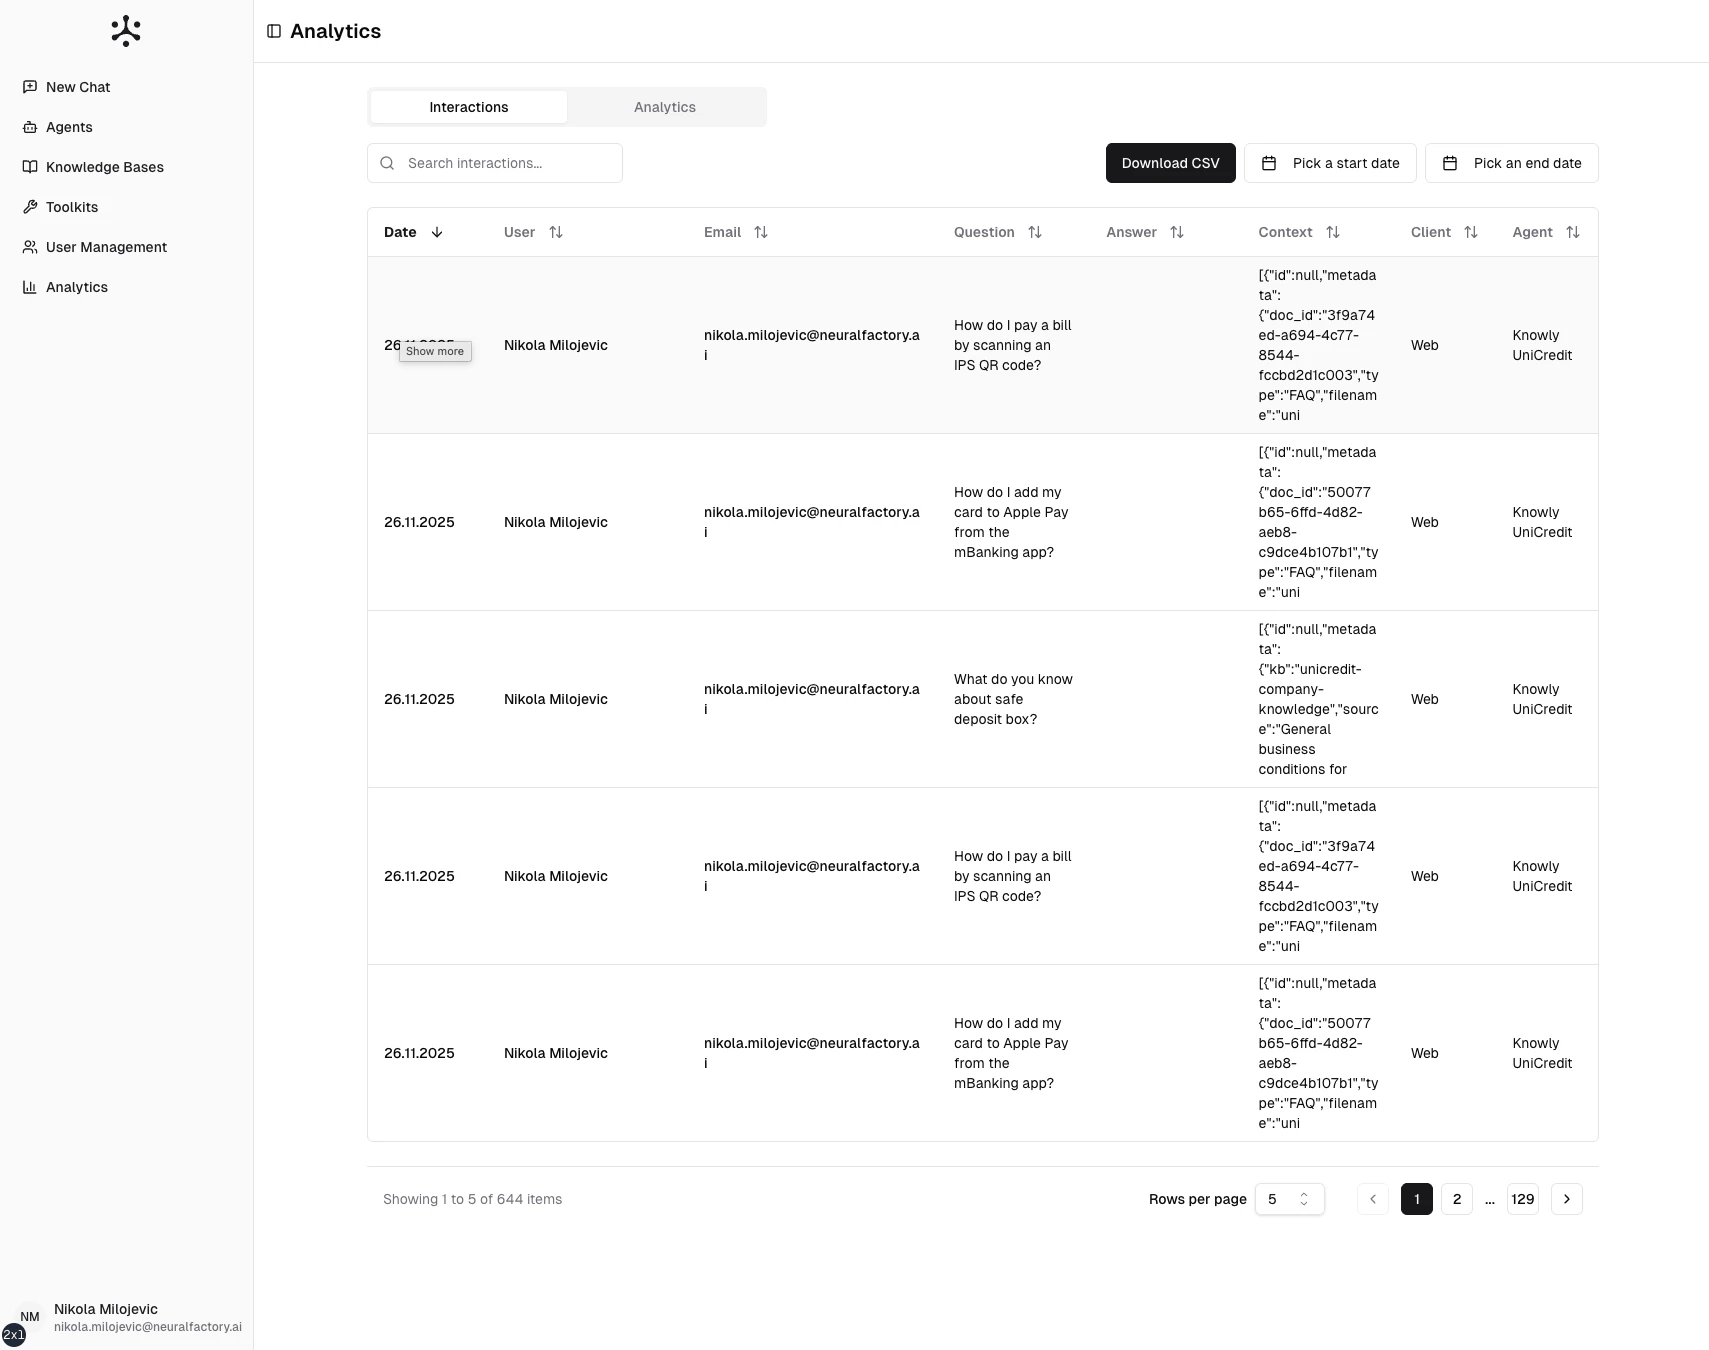 Click any interaction to view the full transcript, including tool usage, retrieved sources, and user feedback.
### Filtering interactions
Use filters to narrow the log:
* **Date range** — View interactions from a specific time period
* **Agent** — Filter by specific agent
* **User** — Filter by specific user
* **Feedback** — Show only positively or negatively rated interactions
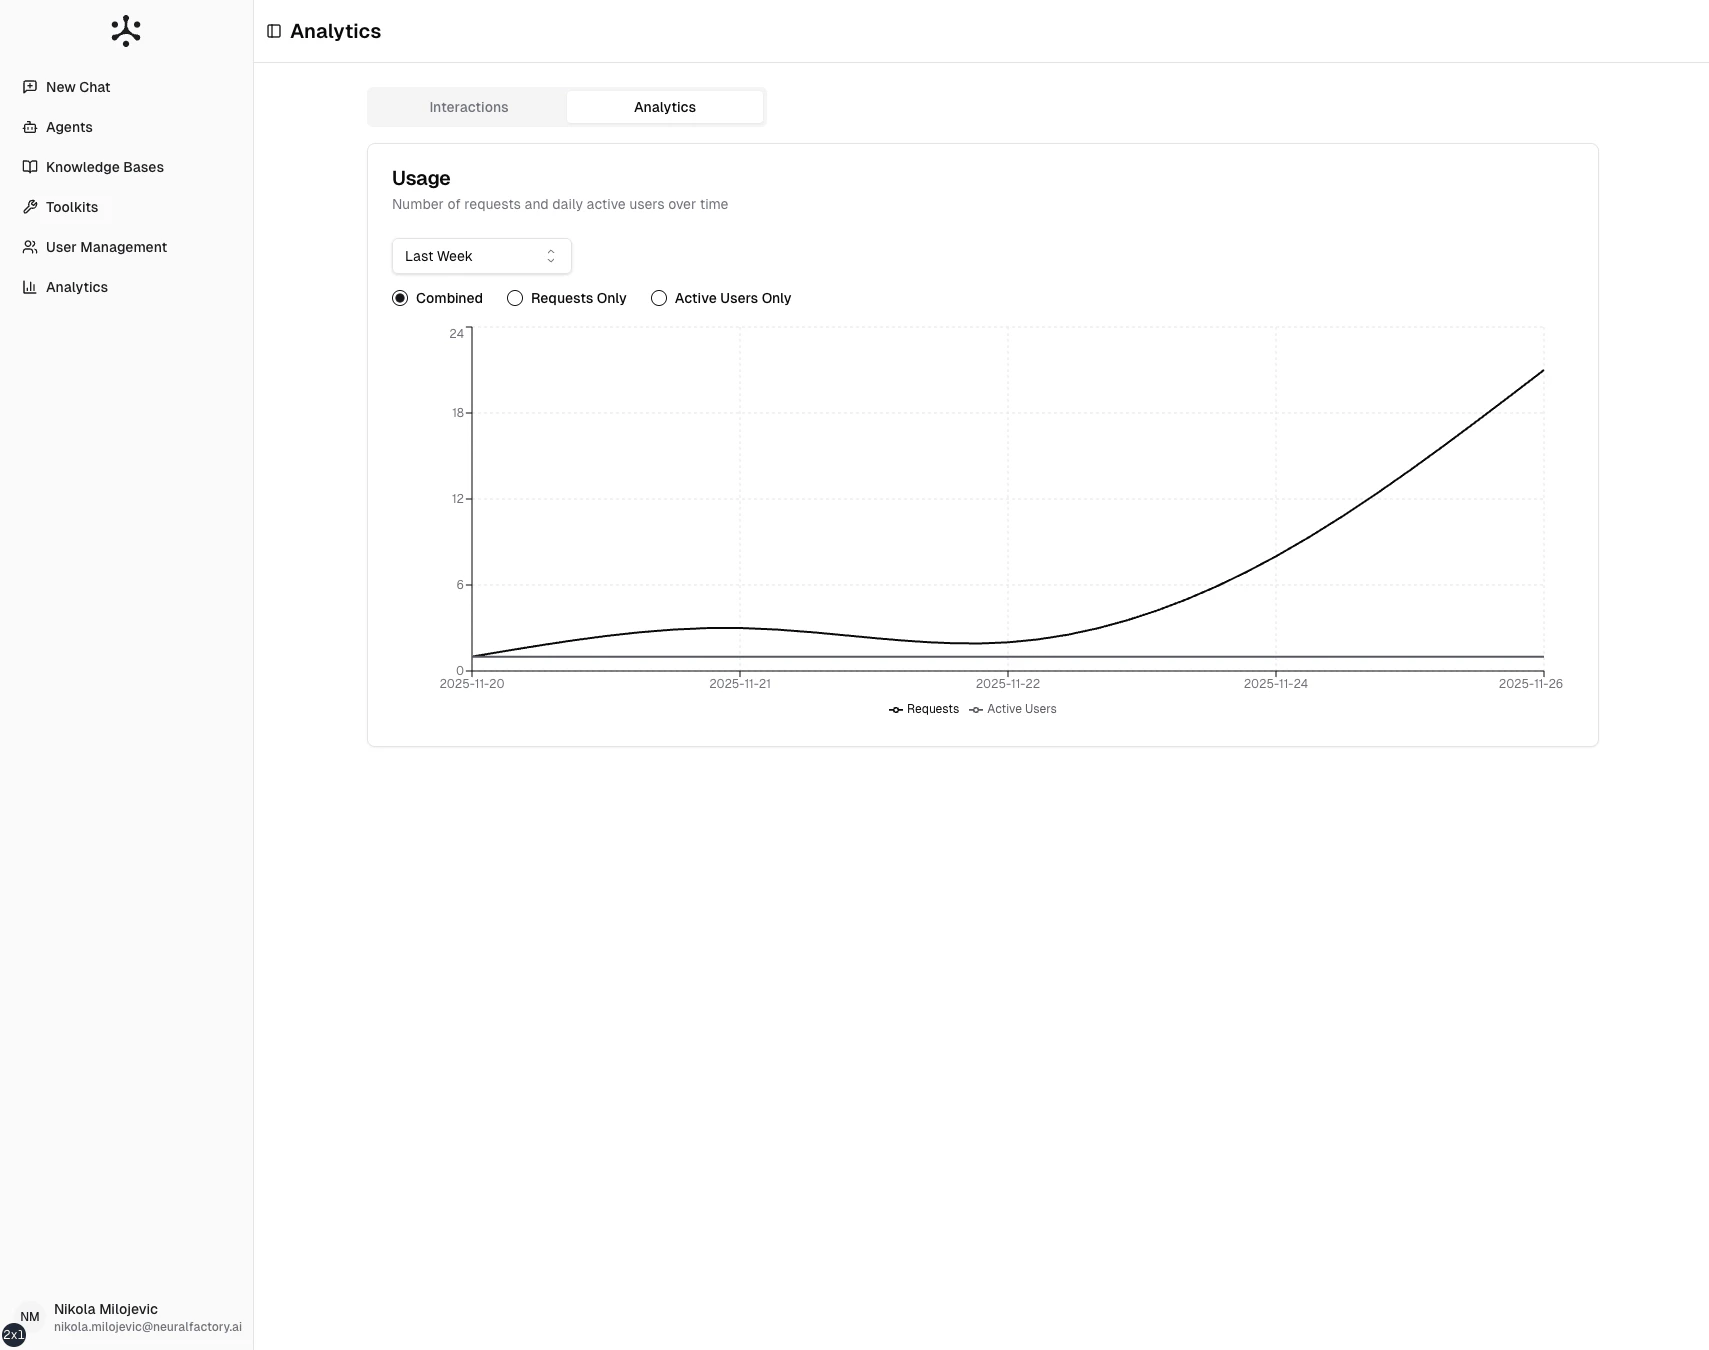
## Usage charts
Visual dashboards showing platform usage trends:
* **Conversations over time** — Daily/weekly/monthly conversation volume
* **Messages per conversation** — Average conversation length
* **Agent usage distribution** — Which agents are used most
* **Active users** — Unique users per time period
* **Token usage** — AI model token consumption over time
Click any interaction to view the full transcript, including tool usage, retrieved sources, and user feedback.
### Filtering interactions
Use filters to narrow the log:
* **Date range** — View interactions from a specific time period
* **Agent** — Filter by specific agent
* **User** — Filter by specific user
* **Feedback** — Show only positively or negatively rated interactions
## Usage charts
Visual dashboards showing platform usage trends:
* **Conversations over time** — Daily/weekly/monthly conversation volume
* **Messages per conversation** — Average conversation length
* **Agent usage distribution** — Which agents are used most
* **Active users** — Unique users per time period
* **Token usage** — AI model token consumption over time
 ## Using analytics to improve
* **Identify popular agents** and those that need attention
* **Find low-rated interactions** to diagnose configuration issues
* **Track adoption** as you roll out new agents or knowledge bases
* **Monitor costs** through token usage trends
* **Justify investment** with usage data showing platform value
## Using analytics to improve
* **Identify popular agents** and those that need attention
* **Find low-rated interactions** to diagnose configuration issues
* **Track adoption** as you roll out new agents or knowledge bases
* **Monitor costs** through token usage trends
* **Justify investment** with usage data showing platform value