

Time: about 15 minutes · Role: Admin (a Member can follow it for their own tasks) · Works on: Enterprise and SaaS (a SaaS personal account sees only its own activity) · You need: some tasks that people already gave your agents
Watch: Review what your agents did (58 s)
What you will have at the end
- One interaction record read from top to bottom: request, steps, outcome, cost and feedback.
- A CSV file of interactions you can share or keep.
- The organization’s totals in Analytics and Settings › Usage.
What a Member sees
These pages show an Admin the whole organization. A Member sees the same pages with their own activity only:
Viewers (Enterprise) have none of these pages. Tasks never shows other people’s tasks, Admins included, so use Interactions for that.
1. Find the task in Interactions
1
Open Interactions
In the sidebar, under Governance, click Interactions. Each row is one agent turn or one workflow run.
2
Narrow the list
Click Agent chats to hide workflow runs. Type a word from the request, such as
allowance, in Search request, subject, person…. The search reads the request and the response; it finds a person’s name or email only when the request came through the API with them, not for tasks sent in the web app. Use Pick a date range for the day it happened, and look for the colleague in the Who column.3
Read the row
The row shows who asked (Who), the agent and its version (Worker, such as
v3), the Request, the Outcome, the Duration and the Cost.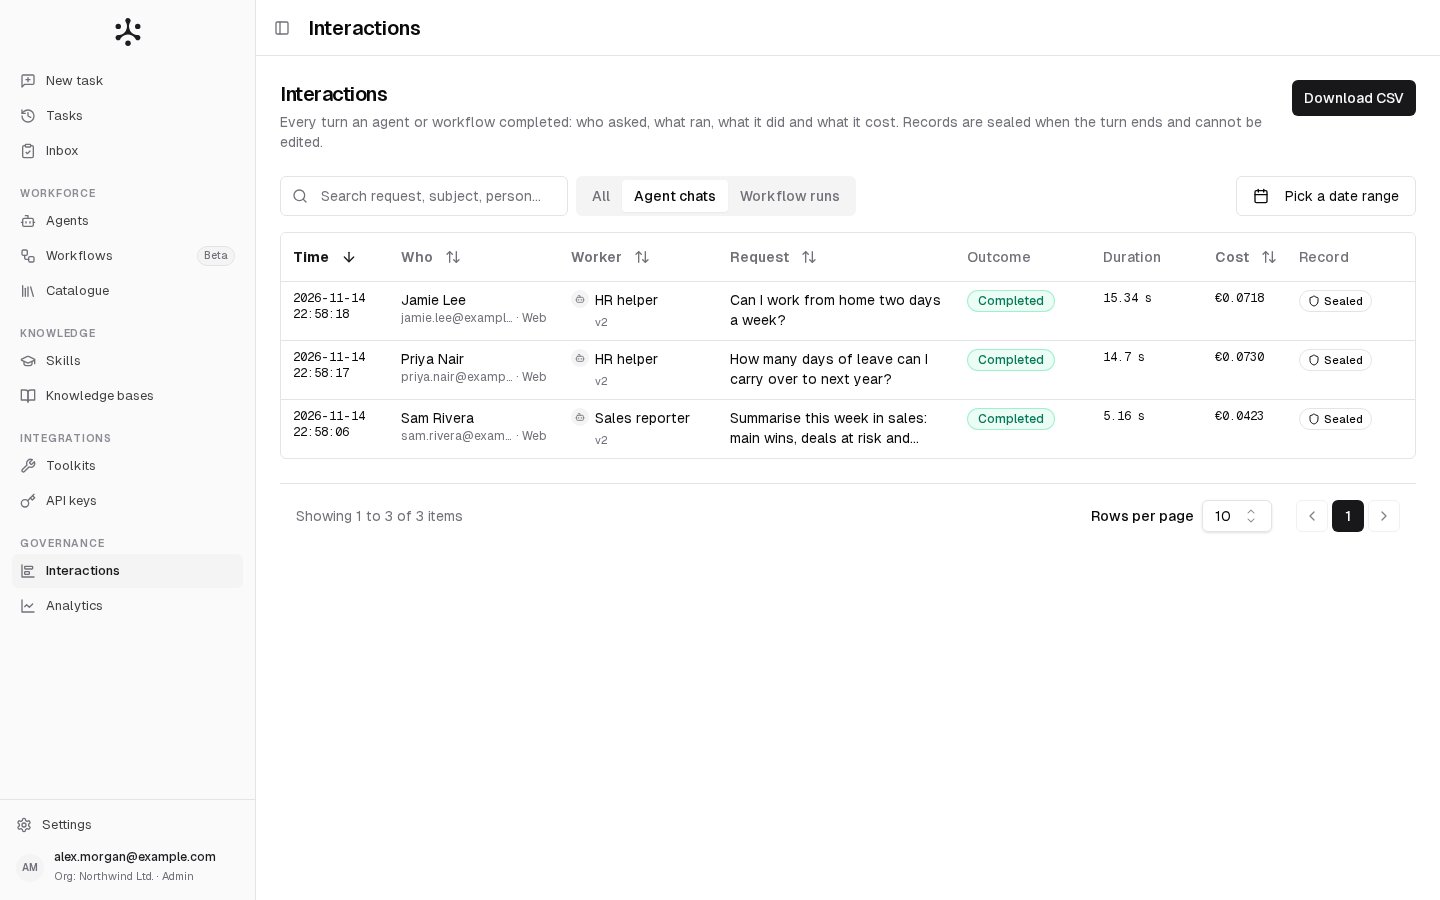
You see the row of the colleague’s question to “HR helper”.
2. Open its record and read what happened
1
Open it
Click the row. The top shows the request, then Worker, Started (who, through which channel, when), Status, Duration and Cost with the number of tokens.
2
Check it is intact
The strip under the header should read Sealed … · verified on open. A record is written once, when the turn ends, and cannot be edited afterwards.
3
Follow the steps
On the Trace tab, every step sits on a time axis: model calls, tool calls, knowledge-base retrieval, subagents. Click a step to read it in the side panel: what the model said, which documents were retrieved, what a tool received and returned. As an Admin you can also preview and download the files the chat attached or produced.
4
Check who and what
The Audit tab lists the person’s role and groups at the time, the agent version, the models, knowledge bases and tools used, and the integrity details.
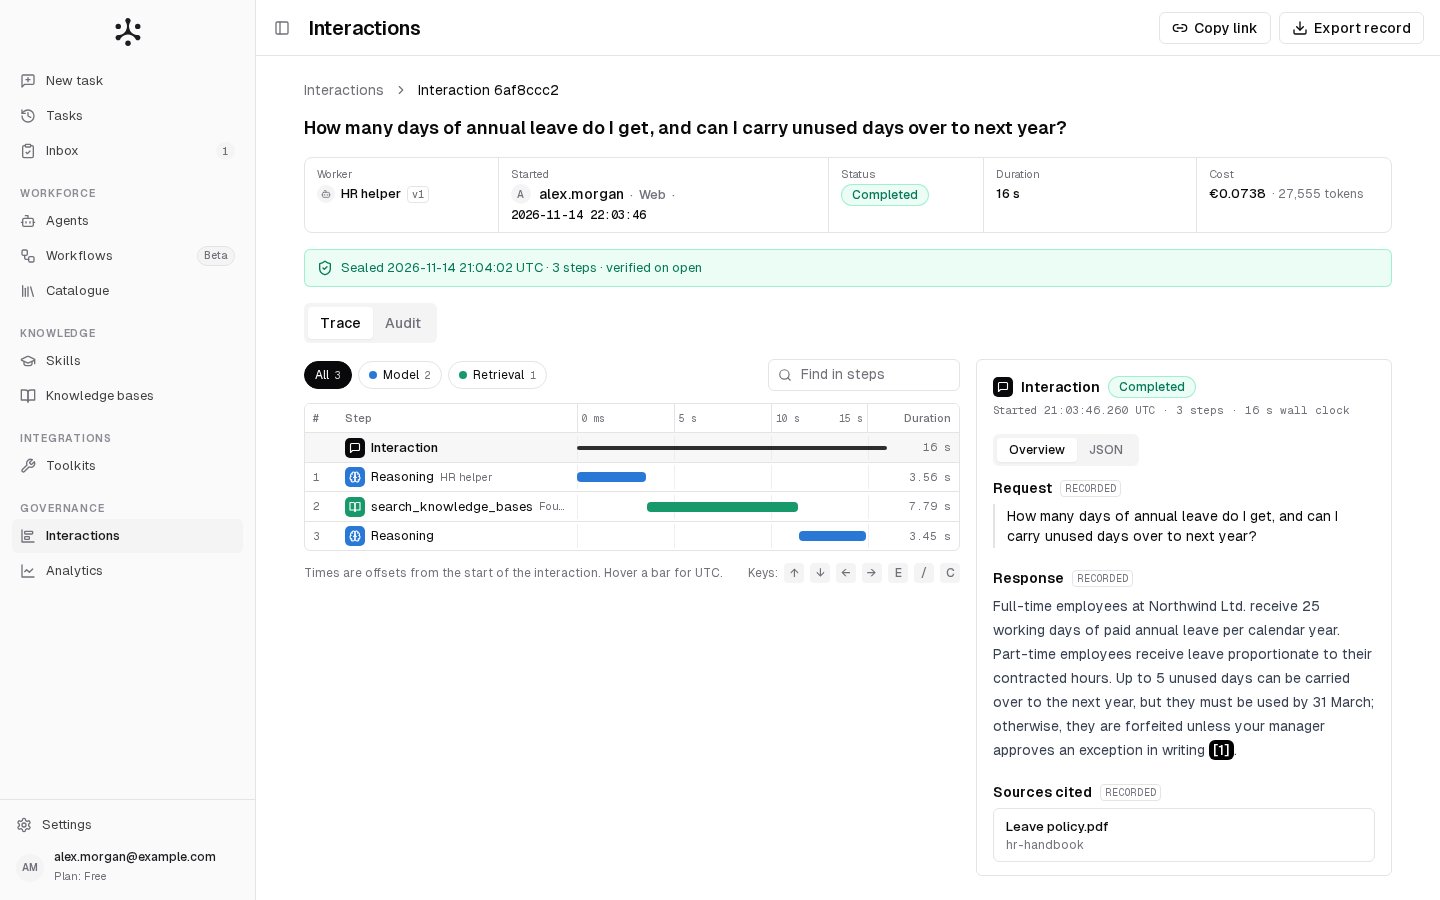
You can say which documents the agent used and what the answer cost.
3. See the feedback
When someone rates an answer, the row’s Outcome shows feedback: up or feedback: down. In the record, click the Interaction row of the trace: the side panel shows the request, the response, the sources cited and, under Feedback, the rating with its comment. A thumbs down in the web app always asks for a comment. Only the person who asked can rate an answer, so the rating is theirs: the person under Who and Started. To collect feedback across many tasks, click Download CSV. The file holds every row you may see for the tab and date range you picked; the search text does not narrow it. Each line has the person, the request and the response, the agent, the tools used, and the feedback with its comment. Times are in UTC.The CSV file opens in your spreadsheet with one line per interaction.
4. Look at the totals in Analytics
1
Open Analytics
Under Governance, click Analytics. Four tiles count everything since the start: Total Requests, Total Agents, Knowledge Bases and Chat Threads.
2
Pick the period
Choose Today, 7 Days, 30 Days or Custom.
3
Read the charts
Requests Over Time shows requests per day, and Active Users for an organization’s Admin. Agent Usage draws a line for each agent picked under Select Agents; if “HR helper” is not among them, click Select Agents and pick it. Usage (Enterprise) or Usage & Billing (SaaS) shows the cost per day.
The “HR helper” line in Agent Usage shows the day of the task you opened.
5. Check spend in Settings › Usage
1
Open Usage
Click Settings at the bottom of the sidebar, then Usage. The cards show what was used against the plan or budget.
2
Look per person
Usage by User has one row per person. Search it by name or email.
3
Look per charge
Usage Events lists every charge with its Date, User (shown to Admins only), Agent, Tokens and Cost. Pick 1d, 7d, 30d or Custom; days are counted in UTC. Export CSV downloads the events of the period and search shown.
- Enterprise: costs are at provider cost.
- SaaS: costs include the platform margin, and a badge says how each charge was paid: Included, Top-up or Not charged.
The task you opened in stage 2 appears in Usage Events, under “HR helper” in the Agent column.
If something goes wrong
- The task is not in Interactions. A run that fails before its first model call leaves no record. As a Member, you see only your own. Check the tab (All, Agent chats, Workflow runs) and the date range.
- The strip reads “This record was changed after it was sealed.” The check failed, and the strip names the first step that no longer matches. Click Export record and send the file to support.
- The strip reads “No step record.” The interaction is older than step-by-step records. Only the request, the response, the names of the tools and the totals are kept.
- The Cost column shows a dash. That turn had no cost.
Where to go next
- Interactions: every column, state and tab of the record.
- Analytics and Usage: the totals in detail.
- Feedback: how people rate answers.